Difference between revisions of "Search for CP violation in the gamma-ray sky"
(→Results) |
(→Schema) |
||
| Line 8: | Line 8: | ||
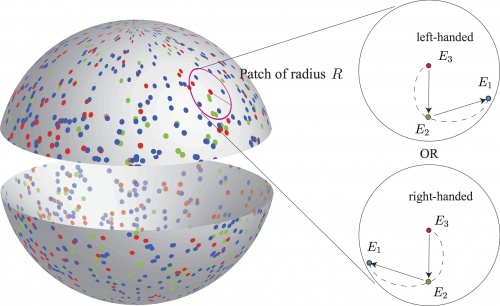
Illustration of the cut-sky with gamma rays distributed on it. Patches of radius R | Illustration of the cut-sky with gamma rays distributed on it. Patches of radius R | ||
degrees are centered on the highest energy gamma rays. In those patches we | degrees are centered on the highest energy gamma rays. In those patches we | ||
| − | test if the lower energy photons are distributed along left- or right-handed spirals. | + | test if the lower energy photons are distributed along left- or right-handed spirals. For |
| + | more details, refer to [http://arxiv.org/abs/1310.4826]. | ||
== Fermi Data == | == Fermi Data == | ||
Revision as of 15:17, 19 May 2014
Contents
Schema
Illustration of the cut-sky with gamma rays distributed on it. Patches of radius R
degrees are centered on the highest energy gamma rays. In those patches we
test if the lower energy photons are distributed along left- or right-handed spirals. For
more details, refer to [1].
Fermi Data
Galactic Latitude and Source Cuts
Galactic latitude and Source Cuts
Evaluation of CP Odd Statistic (Q)
Mathematica notebook (Vachaspati): File:Cpgamma-northsouth.nb
Monte Carlo Simulations
Results
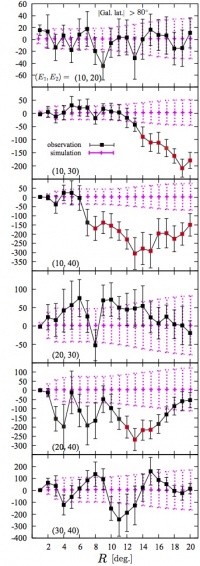
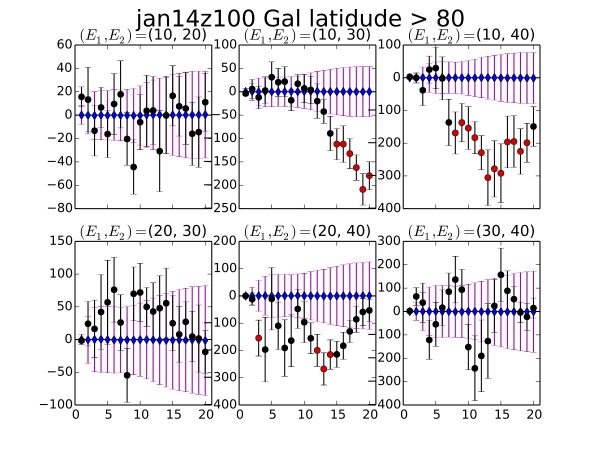
CP odd statistics, Qx10^-6, versus patch radius R in degrees for the 6 different energy (E1,E2) combinations. E3 is always taken to be 50 GeV. On the left are results of Tashiro's routines; on the right are consistent results obtained using Ferrer's routines. 1*sigma spreads of the Monte Carlo simulations are shown as magenta error bars. The data points are the results from Fermi data together with 1*sigma standard errors. Points that deviate by more than 2*sigma, where sigma = max{Monte Carlo spread, standard error}, are colored in red.


